In this update, we present charts and data from key areas of the US economy for this quarter: the Consumer, the Employment Situation, the Housing Market, and Consumer Sentiment.
In Summary:
- Second quarter US Real GDP (released in the third quarter) grew at a 3% annual rate. This was a welcome development after two consecutive quarters of slowing GDP growth. The growth was driven by an increase in private inventory investment and consumer spending, partially offset by a downturn in residential fixed investment compared to the prior quarter.
- The US Consumer remains resilient but low savings rates and rising credit card delinquencies bear watching.
- The employment situation had been strong coming out of the Pandemic but recent employment data points to a negative trend.
- The Housing market has felt the affects of higher interest rates most acutely with existing home sales plummeting, pending home sales near record lows and elevated mortgage rates.
- Subjective measures of Consumer Sentiment have improved since the lows of 2022 but remain well below average. Sentiment is particularly poor in the housing market with a record low number of people feeling that this is a good time to buy a house.
Consumer
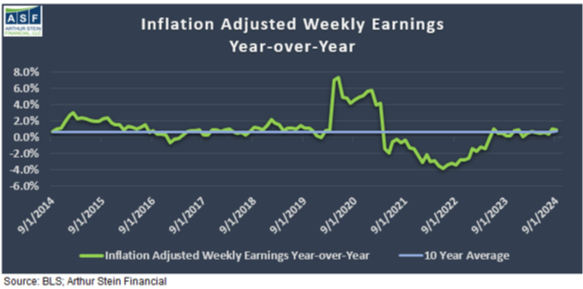
Inflation-adjusted weekly earnings advanced modestly but have been below the 10 year average for 8 of the last 12 months.
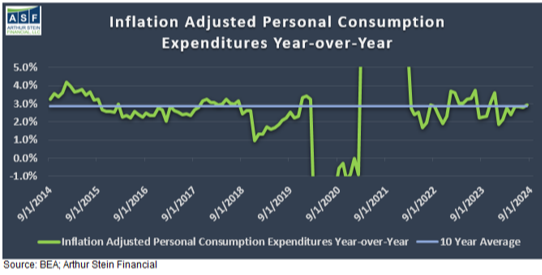
Inflation-adjusted consumer spending remains positive and continues to hover around longer term averages. It will be important to watch for signs of decelerating consumer spending for its impact on US growth (see our blog for why consumer spending matters so much).
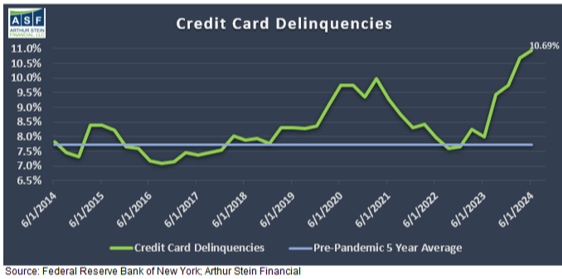
Personal Savings continued to fall in the quarter and remains well below the 10 year average and the pre-pandemic level. This has led more consumers to buy on credit. About 1 in 10 credit card holders face delinquency, which is significantly above the pre-pandemic average.

Employment
The employment situation has been strong coming out of the pandemic but a few trends have emerged which point to weakening in the labor market so these are worth paying attention to. Please read our blog for a detailed look at the US Labor Market.
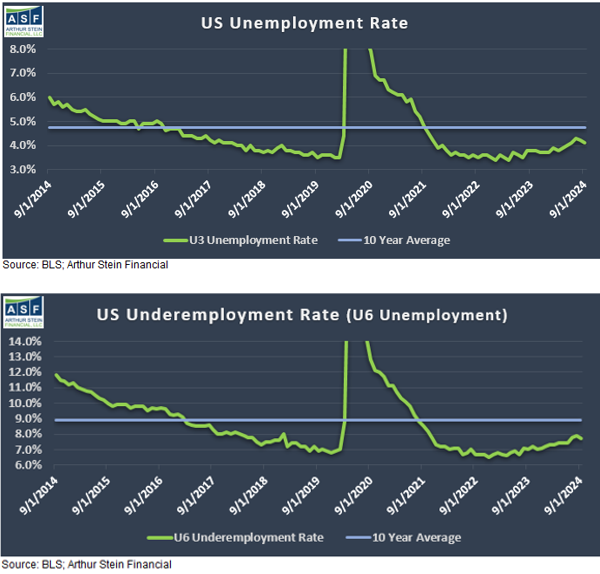
- The traditional unemployment rate (U3 unemployment) came in at 4.1% in September vs 3.7% at the end of 2023. This remains low historically but has increased. The underemployment rate (U6 unemployment) also remains elevated.
- The unemployment rate recently moved above its 36 month moving average which has historically been a recession indicator. It is possible that this time is different, but this measure has consistently preceded recessions.
- Continuing claims for unemployment insurance remain elevated. A high or increasing number of continuing claims indicates it is difficult for unemployed people to find work and will keep the unemployment rate sticky.
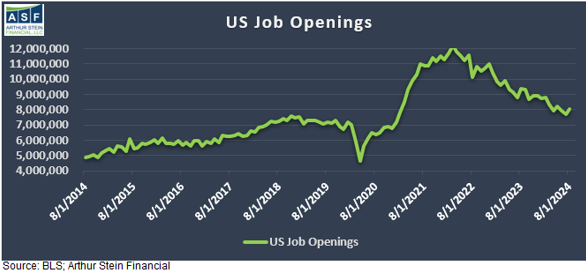
- And finally, the number of unemployed people has risen fairly dramatically with about 1.1 million more people unemployed since the beginning of 2023. At the same time, the number of job openings in the US fell to the lowest level since early 2021.


Housing
The housing market remains beleaguered, mostly due to interest rate and supply dynamics.
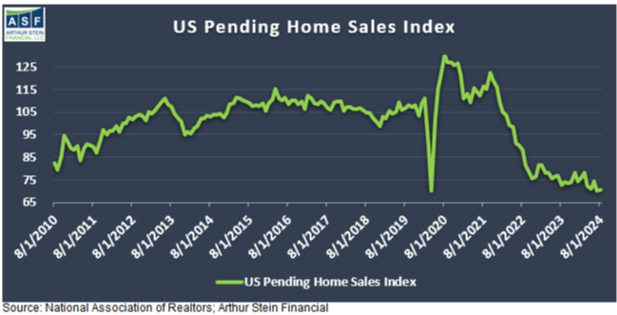
Growth in existing home sales has remained in negative territory for three years. September’s annualized rate of 3.84 million existing home sales was the lowest since October 2010. Overall, the housing market appears nearly frozen as the index of pending home sales in the US is near the lowest level in the index’s history.

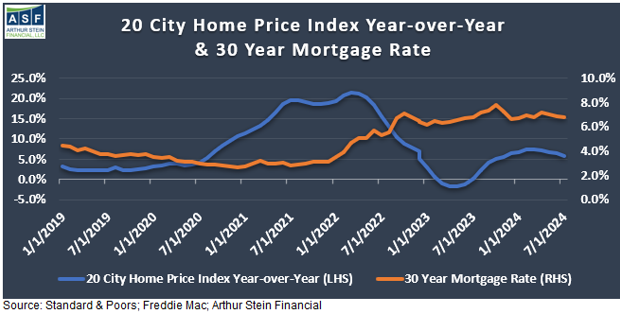
Home prices are still rising but at a much slower rate than the Covid-era (blue line), partially due to higher mortgage rates (orange line).
Sentiment
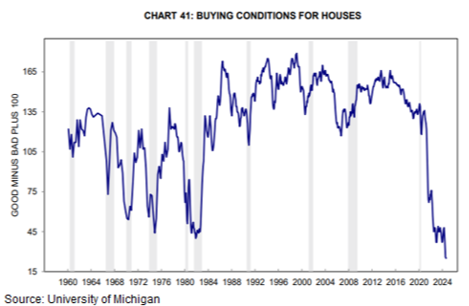
Finally, Consumer Sentiment - as measured by the University of Michigan - has risen from the 2022 lows when inflation peaked but remains well below average.
Perhaps the area where Americans feel least optimistic is in their ability to buy a house (as we referenced above). According to the same University of Michigan survey, the number of respondents who believe this is a good time to buy a house is at a record low.