


US Employment Situation – September 2024
The labor market and employment trends are a critical part of the US economy and we know that the economy and labor market were severely disrupted due to Covid. But what is the state of the labor market now? Are jobs expanding or contracting and where is the relative strength and weakness in the job market? How is this data even measured?
We will go through a summary of the US labor market, explain some of the key metrics, and attempt to draw some conclusions about the state of the US employment situation.
Employment Reports
There are three primary reports generated by various government agencies that economists, the Fed, market participants, politicians, and others study to understand the state of the US Labor Market:
- The Employment Situation Summary report,
- The Job Openings and Labor Turnover Survey report, and
- The Weekly Unemployment Claims report.
Government data rely on surveys since it is not possible to survey each person or business so the reported figures are extrapolated and therefore are not fully accurate or complete. Declining survey response rates has made the initial data less reliable than it has been in the past.
Employment Situation Summary Report
The Employment Situation Summary report is released by the Bureau of Labor Statistics on the first Friday of each month and can be found here.
The figures presented in the report come from two different surveys conducted by the BLS.
- The Establishment Survey (which surveys about 122,000 businesses) reports payrolls numbers.
- The Household Survey (which surveys about 60,000 households) reports unemployment figures.
The following are the key metrics that come from this report.
- The Unemployment Rate, the Underemployment Rate, and reasons for unemployment.
- The labor force and labor force participation rate.
- Nonfarm Payrolls (NFP), or the total number of people employed and the change in this figure.
- Average earnings and hours worked.
Job Openings and Labor Turnover Survey Report (JOLTS)
The JOLTS report is released by the Bureau of Labor Statistics about a month after the Employment Situation Summary report and can be found here. It is used as a complement to other data to gauge labor demand by businesses and workers.
The key metrics that come from this report are job openings, hires, and separations (quits and layoffs).
Weekly Unemployment Claims Report
The Unemployment Claims report is released by the Department of Labor each Thursday and can be found here. It measures new and continuing claims for unemployment insurance and can be used as an indicator of where the unemployment rate is headed. The key metrics that come from this report are Initial and Continuing claims for unemployment insurance.
Current State of the Labor Market
The labor market is not nearly as strong as it was during the post-Covid economic recovery.
This is clear based on the data and was mentioned by Fed Chair Jerome Powell as a reason for the recent interest rate cut during his September 2024 press conference. The question is: is the labor market simply normalizing or is it weakening with a concerning intensity?
It is more important to look at the trend of the data points and not the level because the direction is more informative of changes in conditions and future outcomes.
Employment & Unemployment
According to the Household Survey of the BLS’s employment report, the US has about 161 million employed people.
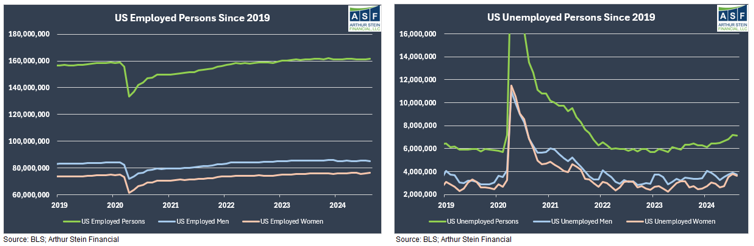
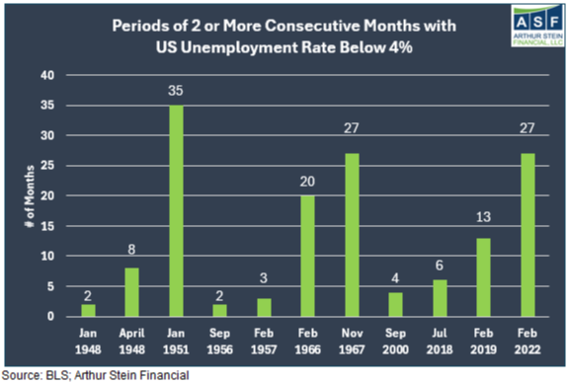
Outside of the obvious Covid disruption, the unemployment rate over the last decade has been below the long term average. In fact, there were extended periods with an unemployment rate below 4% just before Covid and during the post-Covid-recovery.
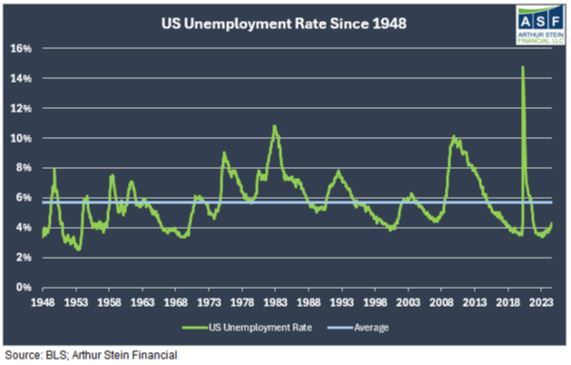
While this has undoubtedly been a strong labor market, that strength is starting to crack.
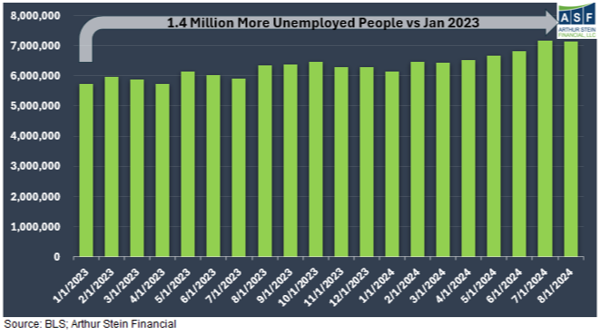
Since the beginning of 2023, the unemployment rate has steadily moved higher from 3.4% to 4.2%. That means there are 1.4 million more unemployed people in about a year and a half.
Some other trends….
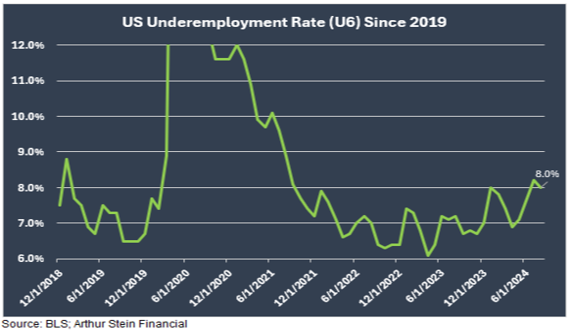
Underemployment: Someone is underemployed if, for example, they are a high-skilled worker but are working in a low-skilled job or are seeking a full-time job but can only obtain part-time work for economic reasons.
Although the rate is only about 1% higher than pre-Covid, the trend is higher over the last year or so. These individuals are employed but are not able to find work that meets their potential earnings and productivity.
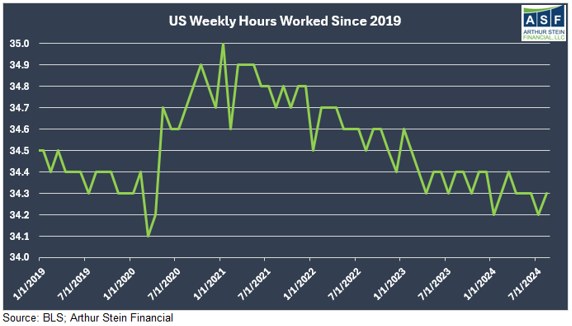
Hours: Businesses typically cut hours before laying workers off so we can look at the number of weekly hours worked to continue forming the picture of the employment situation. Clearly the trend is lower so many employed individuals are able to work fewer hours to earn wages.
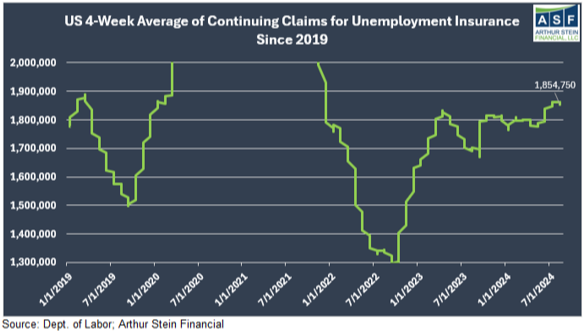
Unemployment Claims: Continuing claims for unemployment insurance give us a sense of the ease or difficulty with which unemployed people can find a job. A rising figure can be one of the first signs of unemployment trouble.
In 2022, continuing claims hit their lowest level in five decades but have dramatically increased since and are well above their pre-Covid levels. Again, the trend is moving in the wrong direction.
Hiring and Separations
Most of the above data come from the Household Survey in the Employment Situation Summary report. The below payrolls data comes from the Establishment Survey.
There can be a significant spread between what these two surveys suggest about the health of the labor market and that has been particularly acute in this post-Covid cycle. It has been a point of contention for users of labor data.
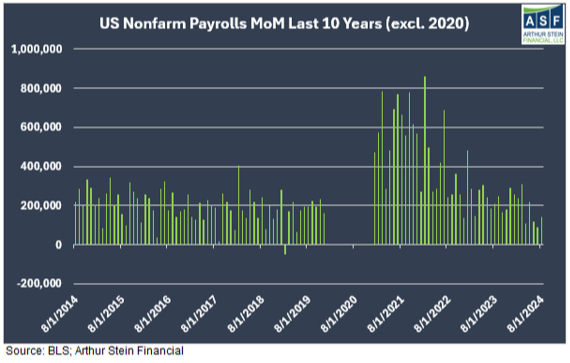
According to the Establishment Survey, the US has averaged 184,000 jobs added per month in 2024.
This is comparable to 2018 and 2019 but the number of monthly jobs added has trended lower and the 89,000 added in July 2024 was the lowest since 2020.
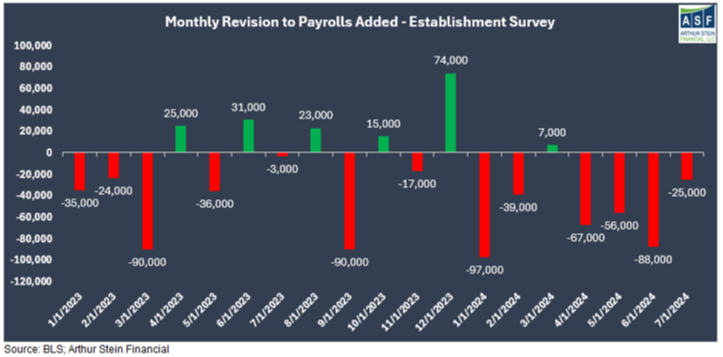
We mentioned that more assumptions are required due to lower survey response rates. That has resulted in significant final revisions to the initial report. Since the start of 2023, 13 of the monthly revisions have been downward, while only 6 have been revised upward. The downward revisions were generally larger.
The Labor Department revised the April 2023 – March 2024 jobs numbers down by 818,000, meaning about 30% of the jobs we thought were added never really occurred.
This means the labor market is generally weaker than the initial headlines reported and that we need to wait longer to get a more accurate picture.
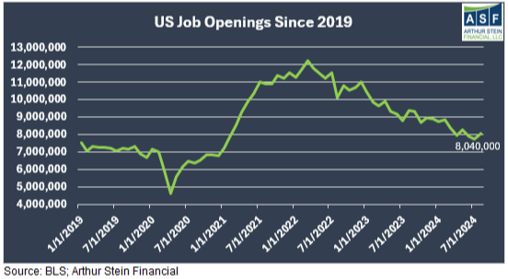
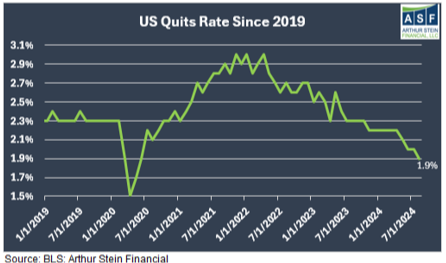
Job openings spiked in 2021 and 2022 as the economy reopened and employers had to manage a wave of employee quits. There are about 7.6 million jobs available according to the BLS: back to the same level as early 2021. This trend has moved down steadily as the Federal Reserve intended.
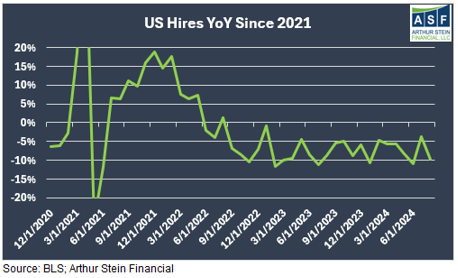
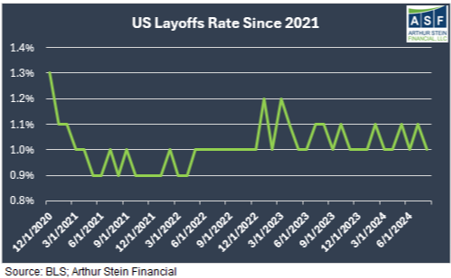
With fewer jobs open, companies are hiring less. However, they have also been slow to lay employees off and those employees are quitting at a much lower rate. A declining quits rate implies fewer people are voluntarily leaving their jobs: usually an indication that workers are worried about finding another job after quitting.
As a result, the jobs-workers gap (red line below) has come back toward equilibrium.
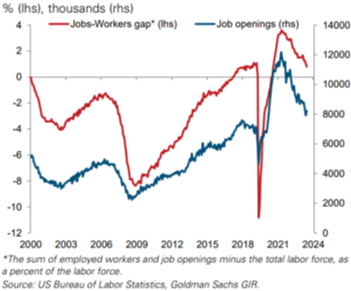
These figures show that the labor market is weakening, but some degree of cooling was needed to bring it into better balance following the Covid-era disruptions.
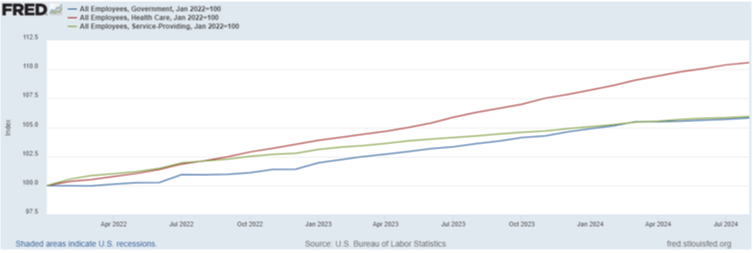
Who is Gaining and Losing Jobs?
Since 2022, the sectors with jobs growth are Government (blue line), Healthcare (red line), and service workers (green line)…
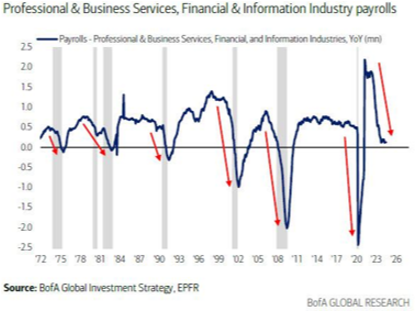
…and the sectors with jobs contracting are mainly white-collar workers.
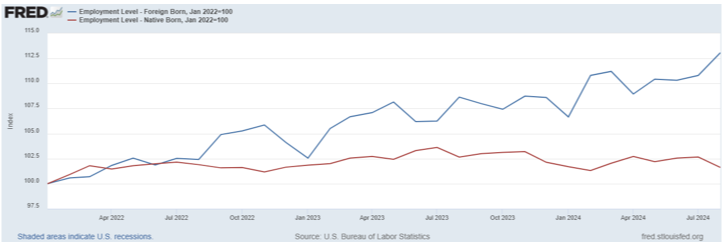
Since 2022, job growth has been much more robust for foreign born workers (blue line) than native born workers (red line).
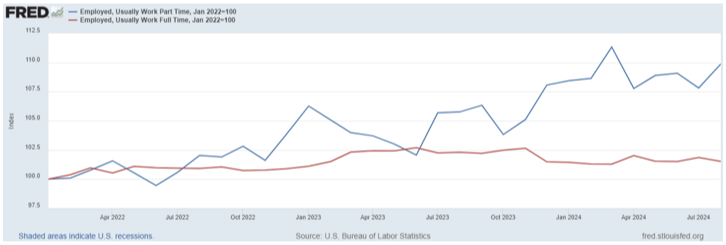
Since 2022, part-time jobs (blue line) have increased while full-time jobs (red line) have been stagnant.
Surveys
Sentiment and opinion surveys are generally less useful than hard data but can provide insight into Americans’ experience in the labor market.
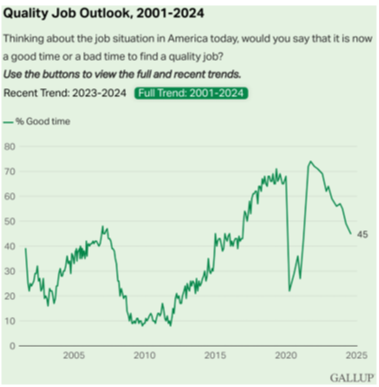
An August Gallup poll showed that less than half of those surveyed feel this is a good time to find a quality job, down from a peak of 74% in 2021.
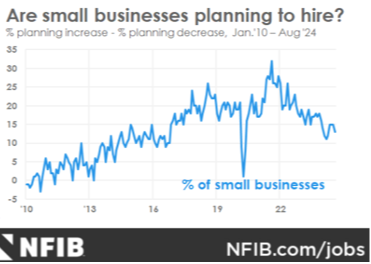
The National Federation of Independent Businesses surveys 10,000 small businesses. The percentage of small businesses planning to hire declined from about 33% in late 2021 to 13% in August 2024.
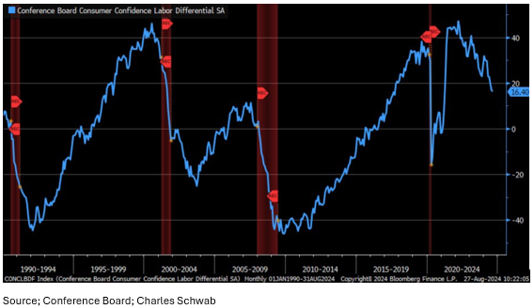
The Conference Board tracks the labor differential which shows the spread between the percentage of respondents saying jobs are plentiful vs jobs are hard to find. The trend shows that people feel it is harder to find work. Declines in this figure have historically occurred during recessions (red bars).
Conclusion
The Kansas City Federal Reserve Labor Market Conditions index aggregates 24 labor market data points into one index and that figure is trending lower.
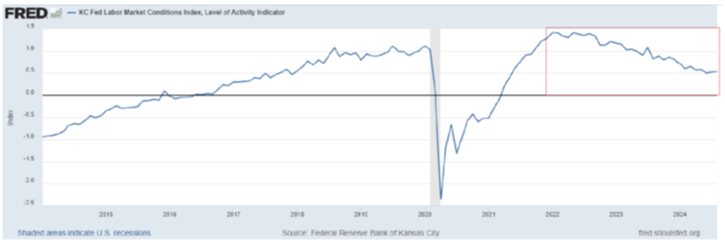
This seems consistent with the data above. The hot labor market is over and a period of cooling has been occurring for a couple years. Coming data will show whether this is just a correction to a normalized level or a driver of a real economic slowdown.
Disclaimers:
This is for educational purposes only. To learn more about the topics mentioned and if they are suitable for you, consult an appropriate professional. Tax laws can change at any time.
Any information provided in this presentation has been prepared from sources believed to be reliable but is not guaranteed and is not a complete summary or statement of all available data necessary for making an investment decision. Any information provided is for information purposes only and does not constitute a recommendation.
Arthur Stein and Arthur Stein Financial, LLC are not authorized to give legal or tax advice. For information on your specific situation, please consult your tax advisor regarding any tax implications and your attorney for legal implications. As required by the US Treasury Regulations, you should be aware that this presentation is not intended to be used and it cannot be used for the purposes of avoiding penalties under federal tax laws.
Keep in mind that:
Past performance is no guarantee of future performance;
Investments involve the risk of loss of principal and earnings;
ETFs, mutual funds, money market funds, etc. are not guaranteed by the US Government, the FDIC, a bank or anyone else.
“Average annual return” evens out variations in the actual year-to-year returns.
ETFs, mutual funds and individual stocks and bonds fluctuate in value and there will always be times when they lose value.
None of the information provided is necessarily relevant to anyone’s personal situation. Circumstances differ among individuals and you should not assume that these generalizations or information apply to you.
Investments mentioned may not be suitable for all investors.
An investment cannot be made directly into an index.