


Both stocks and bonds fluctuate in value; we call that volatility. No one worries when prices fluctuate up. But when prices suddenly fluctuate down, it is felt to be a surprising and painful event. When stocks crash, some investors panic.
According to Jason Zweig at the Wall Street Journal, a sudden, unexpected decline in our investments can set off alarm bells in the brain that cause “specialized cells in a region of the brain called the anterior cingulate cortex… [to]respond… firing out warning signals to other parts of your brain that control your pulse, blood pressure and stress hormones — putting your body on almost instant alert.”
Instant alert as in: We worry. We stress. We want to do something. Many investors sell in a panic.
Did you even know that you have an anterior cingulate cortex? Now that you know and realize that it is a troublemaker, what can you do to prevent the resulting emotions from affecting investment decisions?
Here is a suggestion: Treat sudden, severe stock or bond market declines as expected – instead of unexpected – events. You are less likely to panic if you expect large declines.
And you should assume a big decline is coming because declines are always in our future. Declines are part of the market cycle. It is only a question of when.
The table below summarizes the average number of small, medium and large stock market declines since 1900.
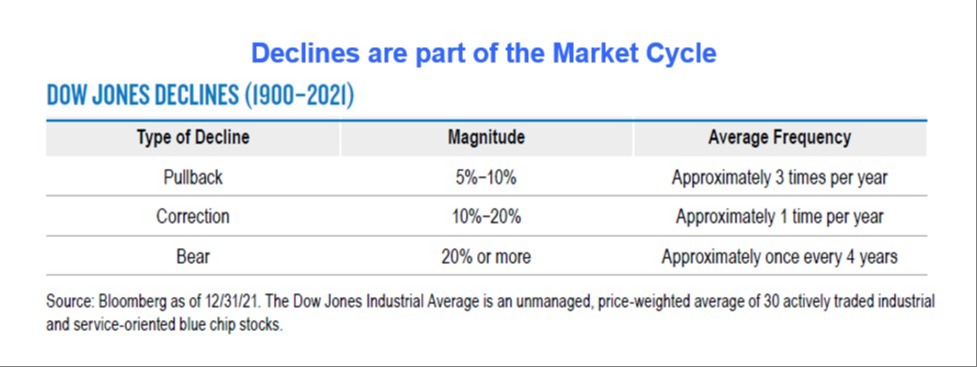
On average, 5%-10% stock market declines occurred three times a year and 10%-20% declines once a year.
A “bear market” (a 20% or greater decline from a previous high) occurred approximately once every 4 years. There should be no reason for surprise when a Bear Market happens.
For an illustrated guide to Bull and Bear Markets, click here.
What made stocks a good investment is that, historically, the market always recovered from declines and larger declines were usually followed by larger recoveries.
The stock market somewhat resembled walking up a hill with a yo-yo. While walking up the hill, the yo-yo was going up and down and up and down. But because the person was walking up a hill, at a certain point, even when the yo-yo was at its lowest point, it was still higher than it was at its highest point further down the hill.
The graph below illustrates the market from 1926 to 2022. Highlighted downturns include the oil crisis, 1987, dot com crash and the banking and credit crisis in 2008.
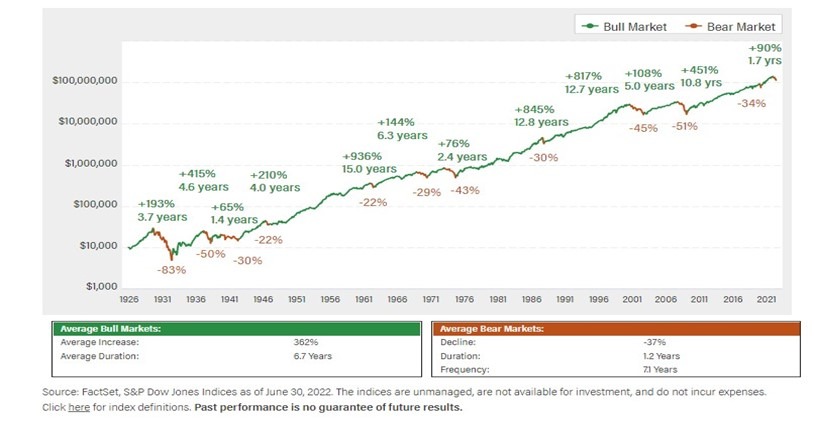
Stocks are represented by the Dow Jones Index. An investment cannot be made directly in an index. FReturn represented by the compound annual return.
The graph illustrates that short-term fluctuations in stocks hid a long-term upward trend. Gradually, stock market prices and dividends increased. That’s what's made stocks a good investment over long periods of time for investors in well-diversified and well-managed portfolios.
Investors did not need to constantly buy and sell to profit. They needed to buy and hold for a sufficiently long period of time. Risk and patience were rewarded.
Past performance is no guarantee of future performance. But do you expect the market to decline and never rise again?
“The market is the most efficient mechanism anywhere in the world for transferring wealth from impatient people to patient people.” Warren Buffett.