


All the TSP funds performed remarkably well in 2025. Despite sharp declines in C and S in the first quarter, stock markets (and the C, S and I Funds) posted double-digit returns for the year.
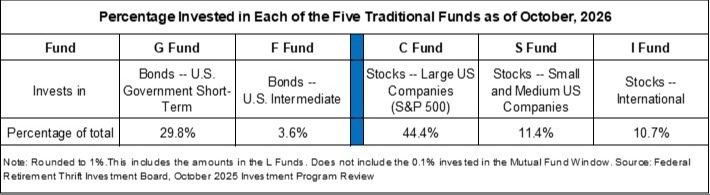
The Five Traditional Funds
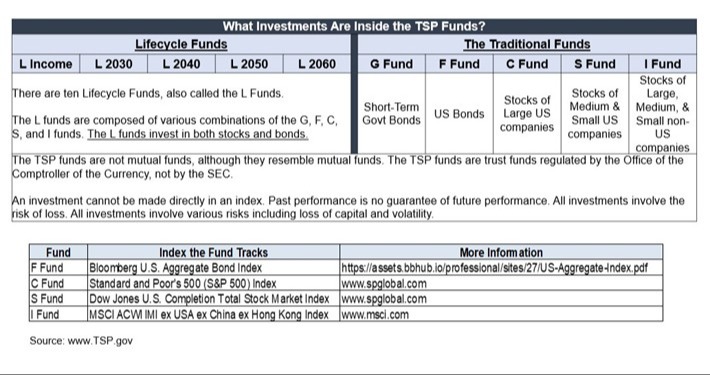
The five Traditional TSP Funds own either stocks or bonds on behalf of TSP investors. When foreign and U.S. stock markets fluctuate in value, the stock funds (C, S and I) fluctuate in value because they own stocks. When U.S. bond markets fluctuate in value, the F Fund fluctuates in value because it owns bonds.
The G Fund does not fluctuate in value. Think of it as a savings account with a high interest rate.
Because U.S. stock and bond markets did well in 2025, the five Traditional funds did well.
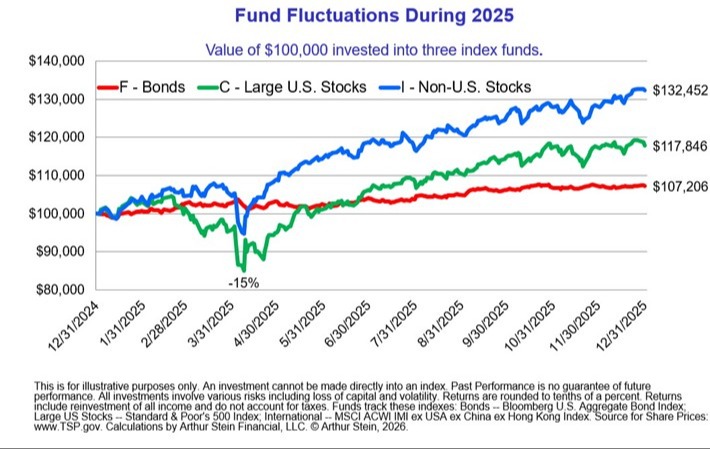
The April decline in the stock funds was primarily due to the "Liberation Day" tariff package. But after the announcement, many countries sidestepped U.S. tariffs via alternative trade routes and the Trump administration reduced or eliminated others. Since initial effects proved less disruptive than expected, the stock markets recovered.
A notable change was that the I Fund (foreign stocks) outperformed the C and Funds (U.S. stocks) by a significant amount. The I Fund increased 32.5% for the year, which was the largest outperformance of the I Fund versus C Fund since 2009. These gains were aided by a 9% decline in the U.S. dollar and improving growth expectations in many countries.
Despite the I Fund's strong outperformance last year, it underperformed the C Fund over the last 5, 10 and 15-year averages.
The F Fund (government, corporate and mortgage bonds) also delivered strong returns as the Federal Reserve cut interest rates three times, yields declined, and markets priced in lower credit risk, which supported broad bond market gains. The F Fund returned 7.3% for the year, a significant reversal from prior years’ losses and the best year for the index since 2020.
The G Fund (short-term U.S. Government securities) returned a steady 4.4 percent, slightly higher than high yield bank accounts.
Returns for the five traditional TSP funds are now strongly positive over all time periods, except for the F Fund’s still negative five-year average.

Last year’s top performing stock fund (I) was the least popular stock fund. The top performing bond fund (F) was the least popular bond fund.
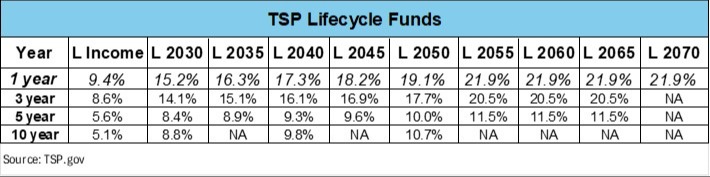
Lifecycle Funds
The TSP Lifecycle (L) Funds invest in the five traditional funds and nothing else. They are the TSP equivalent of Target Date Funds which are common outside the TSP and work the same way.
When a Lifecycle fund is introduced, it is almost completely invested into the three stock funds. As time goes by the allocation begins shifting to the bond funds (F and G). The change is called the “glide path.”
When an L Fund matures (reaches the stated year), your assets are automatically rolled (transferred) to the L Income Fund, which currently invests 73% of its assets into the bond funds and the remainder into the stock funds.
As an example, here is the glide path for the TSP L2070 Fund.
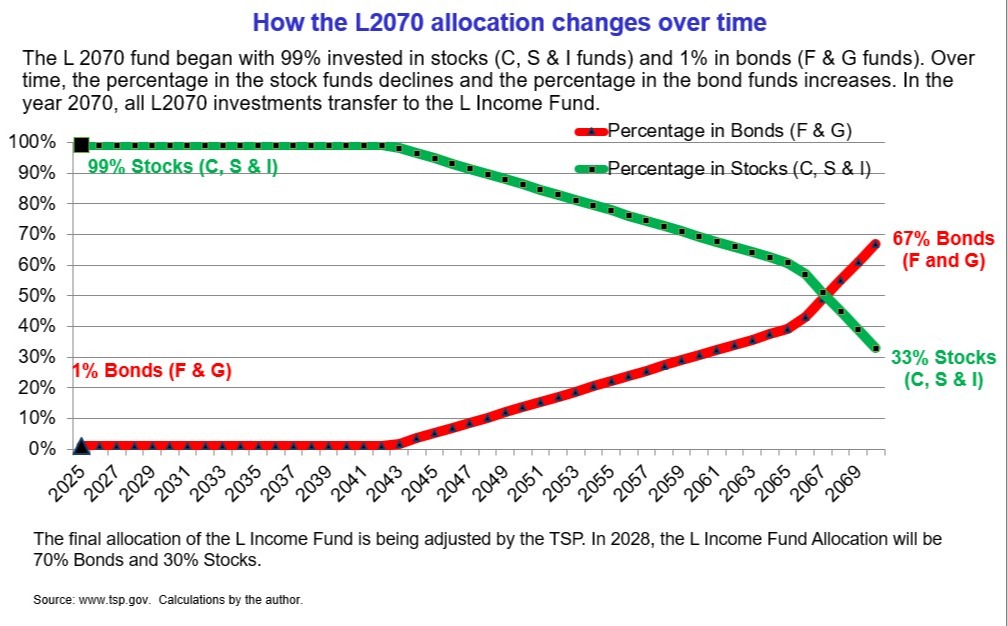
Because the longer dated funds (L2070 and L2065) invest a higher percentage into the stock funds, the longer dated funds outperform when stocks are doing well.
Choosing Between the TSP Funds
With the TSP stock funds at or near record highs, TSP investors face a dual reality:
- Strong earnings and GDP growth support increases in market values,
- But elevated valuations, concentration risks and potential geo-political risks may indicate lower stock returns in the future. That could lead to negative returns in the stock funds.
Crashes are a normal stock market event. At some point, there will be a stock market crash but we don’t know when or what the cause will be. Major causes of past crashes include a housing market collapse, overvalued technology and internet stocks, the Covid pandemic and rising interest rates. The future crash may be caused by one of those or something completely different.
The terms “Bull Market” and “Bear Market” are used to describe major stock market fluctuations. A Bear Market represents a decline of -20% or more from a previous high. A Bull Market represents an increase of 20% from a previous low. A more detailed explanation can be found here.
The following graph shows the history of Bull and Bear Markets since 1926. There were twelve during this period, an average of one every eight years.

Source: AMG, "Keep Calm and Remain Diversified." 2026.
The averages are very telling.
- The average Bear Market decrease was -39% and lasted 1.2 years.
- The average Bull Market increase was 342% and lasted 6.4 years.
Of course, past performance is no guarantee of future results.
Conclusion
The past year highlighted the importance for TSP investors to stay invested in the stock funds despite volatility and market declines. Historically, long-term investments in well diversified portfolios of stocks (and stock funds) produced a high enough rate of return to increase purchasing power after subtracting out taxes and inflation. Bonds, bank accounts and the G and F Funds in the TSP usually lose purchasing power over longer periods of time.
There have been long-term periods when stocks did not do well enough to maintain purchasing power or where stocks declined in value. But the stock funds in the TSP do offer the potential for returns that are high enough to increase the purchasing power of an investment over a sufficiently long period.
All TSP investors face the same dilemma. Should they invest for:
- The lower volatility and lower chance of losing principal offered by the bond funds but with a higher chance of a decline in purchasing power; or
- The higher potential growth historically offered by the US stock funds, accepting greater volatility and market risk for the opportunity to increase purchasing power.
The answer to that question may well determine the financial future and retirement security of TSP investors.
Disclaimers:
This is for educational purposes only. To learn more about the topics mentioned and if they are suitable for you, consult an appropriate professional. Tax laws can change at any time.
Any information provided in this presentation has been prepared from sources believed to be reliable but is not guaranteed and is not a complete summary or statement of all available data necessary for making an investment decision. Any information provided is for information purposes only and does not constitute a recommendation.
Arthur Stein and Arthur Stein Financial, LLC are not authorized to give legal or tax advice. For information on your specific situation, please consult your tax advisor regarding any tax implications and your attorney for legal implications. As required by the US Treasury Regulations, you should be aware that this presentation is not intended to be used and it cannot be used for the purpose of avoiding penalties under federal tax laws.
Keep in mind that:
- Past performance is no guarantee of future performance;
- Investments involve the risk of loss of principal and earnings;
- ETFs, mutual funds, money market funds, etc. are not guaranteed by the US Government, the FDIC, a bank or anyone else.
- “Average annual return” evens out variations in the actual year-to-year returns.
- ETFs, mutual funds and individual stocks and bonds fluctuate in value and there will always be times when they lose value.
- None of the information provided is necessarily relevant to anyone’s personal situation. Circumstances differ among individuals and you should not assume that these generalizations or information apply to you.
- Investments mentioned may not be suitable for all investors.
- An investment cannot be made directly into an index.